
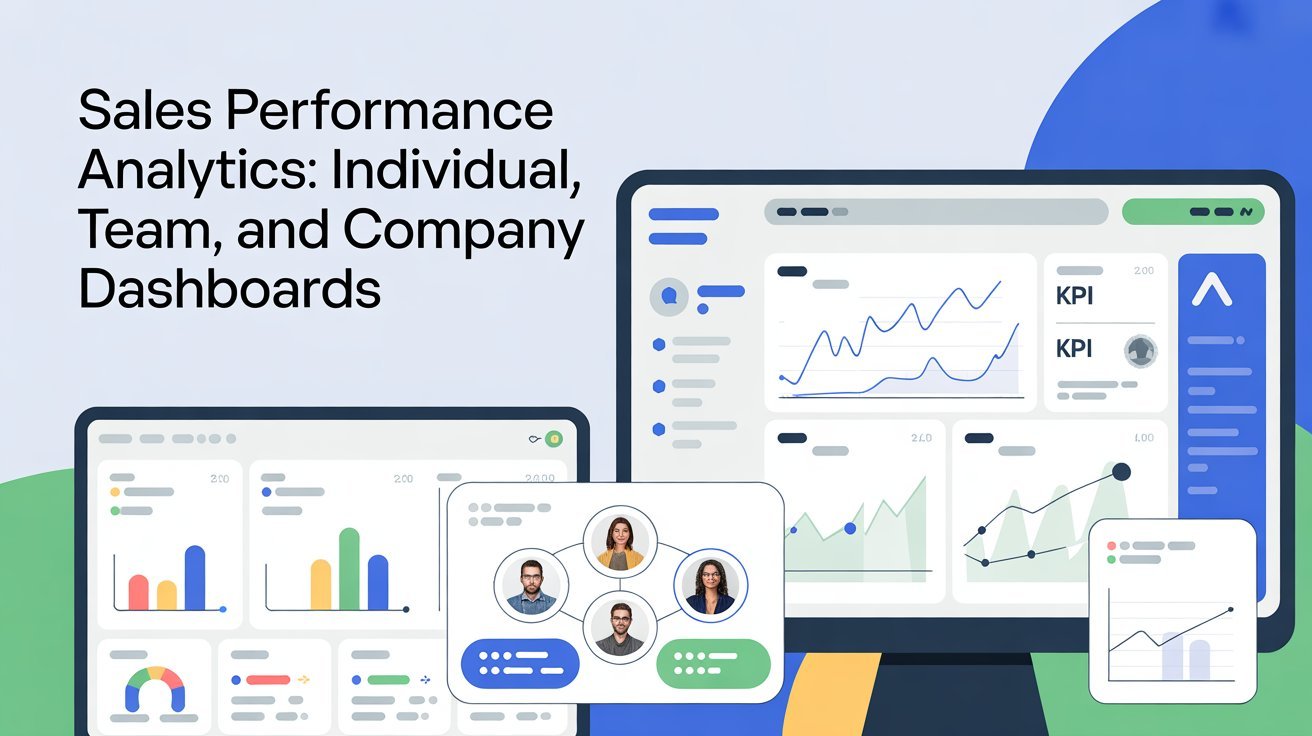


Sales performance analytics harnesses individual, team, and company dashboards to transform your raw data into actionable insights. With tailored individual dashboards, you can identify areas for improvement and boost performance. Team dashboards enhance collaboration and accountability while tracking collective achievements. By focusing on key metrics, you can drive informed decisions across all levels of your organization. Want to discover how cutting-edge tools and future trends can further elevate your sales strategies? Keep exploring.
Table of Contents
Key Takeaways
- Individual dashboards provide personalized insights to enhance sales representatives’ performance through targeted feedback and coaching.
- Team dashboards promote collaboration by aligning shared goals and tracking collective achievements in real-time.
- Company dashboards aggregate data to monitor overall sales performance and identify trends at a macro level.
- Data visualization in dashboards simplifies complex data, enabling quick identification of sales trends and informed decision-making.
- Regular reviews of individual and team dashboards foster continuous improvement and accountability within the sales organization.
Understanding Sales Performance Analytics
Understanding sales performance analytics is fundamental if you want to drive your business forward. By leveraging sales data and performance metrics, you can gain insights into your team’s effectiveness.
Utilizing analytics tools enables you to interpret data accurately, which is essential for sales forecasting. Focus on metric selection to guarantee you’re tracking the right performance benchmarks that align with your goals.
Dashboard features play a significant role in presenting this data, making it easier to understand trends and outcomes. Employ visualization techniques to enhance data interpretation and quickly identify areas for improvement.
Ultimately, maintaining data accuracy will empower you to make informed decisions that propel your business success. Embrace analytics to stay competitive and responsive in your market. Additionally, you can explore project management and design software to further enhance your operational efficiency.
The Importance of Data Visualization in Sales
Data visualization plays an essential role in your sales strategy by enhancing decision-making processes.
It helps you identify sales trends quickly and simplifies complex data insights into actionable information.
When you leverage visual tools, you can make informed choices that drive better results. Additionally, effective visualization aids in user empowerment by providing insights that enhance workflow efficiency and support achievement of goals.
Enhancing Decision-Making Processes
While sales figures can often feel overwhelming, effective data visualization transforms raw numbers into actionable insights that drive decision-making. By presenting data visually, you can quickly spot patterns and anomalies, enabling you to adjust your approach and strategies in real-time.
This clarity fosters a data-driven culture within your organization, where decisions are based on solid evidence rather than gut feelings.
When you use dashboards and visual reports, you’re not just tracking performance; you’re crafting informed strategies that align with your goals. You can prioritize initiatives, allocate resources efficiently, and motivate your team with clear performance metrics.
In short, leveraging data visualization empowers you to make smarter decisions, ultimately enhancing your sales performance and driving business success.
Identifying Sales Trends Quickly
How can you swiftly identify sales trends that impact your bottom line? By leveraging data visualization, you can uncover sales patterns and perform effective trend forecasting.
Analyze consumer behavior to spot market shifts, recognizing how seasonal variations influence your sales cycles. Utilize territory analysis to compare performance benchmarks across regions, ensuring you’re aware of product performance discrepancies.
Competitive analysis further sharpens your insight into where you stand in the market. With these tools, you’ll quickly identify emerging trends that can drive strategic decisions.
Staying ahead means adapting to insights revealed through your sales data, allowing you to respond effectively to changes and enhance overall business performance.
Embrace data visualization to streamline these processes and boost your success.
Simplifying Complex Data Insights
Uncovering sales trends is just the first step; the next challenge lies in making sense of complex data insights.
To achieve insight clarity, you need effective data visualization techniques that promote data simplification. When you simplify data, it becomes easier to interpret and act upon.
Consider these key strategies:
- Use charts and graphs to highlight trends at a glance.
- Employ color coding to differentiate performance metrics.
- Integrate dashboards that allow for quick comparison across teams.
Key Metrics to Track in Sales Performance
When it comes to tracking sales performance, focusing on key metrics is essential. You should pay close attention to your revenue growth rate and sales conversion ratio, as they provide valuable insights into your team’s effectiveness. Monitoring these metrics helps you make informed decisions to boost overall sales success. Additionally, utilizing automation and analytics tools can significantly enhance your ability to analyze these key performance indicators.
Revenue Growth Rate
Revenue growth rate stands as an essential indicator of a company’s sales performance, reflecting the effectiveness of your strategies and market demand.
Tracking this metric helps you understand how well you’re capturing revenue over time. To optimize your growth rate, consider these key strategies:
- Conduct market analysis to identify emerging trends and customer needs.
- Engage in competitor benchmarking to compare your performance against industry leaders.
- Adjust sales strategies based on insights gleaned from your analysis and benchmarking efforts.
Sales Conversion Ratio
While tracking revenue growth rate provides valuable insights into your overall financial health, the sales conversion ratio offers a more focused look at the effectiveness of your sales efforts.
This metric measures the percentage of leads that turn into actual sales, helping you gauge the success of your sales techniques. By analyzing your conversion ratio, you can identify which conversion strategies are working and which need improvement.
If your ratio is low, consider refining your approach—maybe it’s time to enhance your product presentations or follow up more effectively.
Ultimately, keeping a close eye on your sales conversion ratio will empower you to make data-driven decisions that boost your sales performance and drive revenue growth.
Individual Dashboards: Tailoring Insights for Sales Representatives
As you navigate your sales goals, individual dashboards can provide tailored insights that boost your performance. These dashboards help you focus on your individual goals while offering key metrics to enhance your effectiveness.
With the right data at your fingertips, you can leverage:
- Performance feedback to identify areas for improvement
- Personalized coaching to refine your skill development
- Motivation strategies to keep you engaged and productive
Moreover, integrating tech solutions enables you to track productivity metrics and conduct competitive analysis against efficiency benchmarks. Additionally, utilizing performance analytics can empower you to make informed decisions that enhance your overall sales strategy.
Team Dashboards: Enhancing Collaboration and Performance
Team dashboards are key to boosting collaboration and performance among your sales team.
With collaborative goal setting and real-time performance tracking, you can align your efforts and stay on the same page.
Plus, leveraging data-driven decision-making helps you make smarter choices that drive results. Additionally, project management software can significantly enhance your team’s ability to track progress and manage tasks effectively.
Collaborative Goal Setting
Effective collaboration hinges on setting clear, shared goals, which is where team dashboards come into play. By utilizing these dashboards, you can establish a collaborative framework that drives performance and enhances teamwork.
Here’s how you can leverage team dashboards for collaborative goal setting:
- Define shared objectives: Ascertain everyone understands and aligns with the goals.
- Foster open communication: Use the dashboard to encourage dialogue among team members about progress and challenges.
- Track collective achievements: Regularly review the dashboard to celebrate milestones and adjust strategies as needed.
Real-Time Performance Tracking
When you implement real-time performance tracking through team dashboards, you empower your team to stay agile and responsive.
These dashboards provide immediate access to performance benchmarks, allowing everyone to see how they’re doing against established goals. With real-time feedback, team members can quickly adjust strategies and tactics, fostering a culture of continuous improvement.
You’ll notice collaboration enhancing as members share insights and support one another in reaching targets. Plus, identifying trends becomes easier, helping your team recognize areas for growth.
This transparency not only motivates individuals but also strengthens the overall team dynamic. By embracing real-time performance tracking, you create an environment where everyone is aligned and focused on achieving success together.
Data-Driven Decision Making
By harnessing the power of data-driven decision making, your team can elevate collaboration and performance to new heights.
Utilizing team dashboards facilitates strategic alignment and enhances decision frameworks. With the right analytical tools, you can transform raw data into actionable insights, leading to improved data accuracy and risk assessment.
Consider these key aspects for effective data-driven decisions:
- Performance Metrics: Monitor real-time indicators to gauge success.
- Stakeholder Engagement: Foster collaboration through shared insights.
- Feedback Loops: Implement continuous improvement by incorporating team feedback.
Company Dashboards: A Comprehensive Overview of Sales Health
Understanding your company’s sales health is essential for driving growth and making strategic decisions. Company dashboards provide a clear view of key metrics, allowing you to monitor performance effectively. With the right dashboard tools, you can visualize data trends and identify areas for improvement.
| Metric | Current Value |
|---|---|
| Total Revenue | $500,000 |
| Monthly Growth Rate | 15% |
| Customer Acquisition Cost | $200 |
| Sales Conversion Rate | 30% |
Leveraging Analytics for Strategic Decision-Making
As you harness the power of analytics, you can transform raw data into actionable insights that drive strategic decision-making.
By focusing on key areas, you can improve your sales strategy and align your team effectively. Consider these essential components:
- Customer segmentation: Understand distinct buyer behavior to tailor your approach.
- Competitive analysis: Identify market positioning and areas for differentiation.
- Performance benchmarking: Evaluate your sales enablement against industry standards.
Leveraging insights automation helps you streamline data governance, enabling strategic forecasting that anticipates market trends.
This proactive approach not only enhances sales alignment but also fosters an agile and responsive organization, ready to adapt to changing conditions and seize new opportunities.
Identifying Strengths and Weaknesses Through Data
Sales data offers a wealth of information that can highlight both strengths and weaknesses within your team and processes. By performing a strength analysis, you can pinpoint what your top performers do well, allowing you to replicate their success across the board.
Look for patterns in high-performing sales tactics, customer interactions, and closing rates. On the flip side, weakness identification is just as important. Analyze areas where performance lags—be it in specific product categories or sales techniques.
Understanding these gaps enables you to provide targeted training and resources, turning weaknesses into opportunities for growth. Ultimately, leveraging this data-driven approach helps you build a more effective sales strategy, improving overall performance and achieving your goals.
Real-Time Reporting: Staying Agile in Sales
To thrive in today’s fast-paced market, leveraging real-time reporting can give your sales team the agility it needs to adapt quickly.
With real-time dashboards, you gain immediate insights that enhance decision-making and drive performance. This dynamic reporting fosters sales agility, allowing for quick adaptations to market changes.
Consider these key benefits of real-time reporting:
- Data Accuracy: Stay confident in your metrics with up-to-date information.
- Agile Responsiveness: React promptly to shifts in customer behavior and market trends.
- Competitive Advantage: Utilize responsive metrics to outpace competitors and meet performance benchmarks.
The Role of Predictive Analytics in Sales Performance
Building on the insights gained from real-time reporting, predictive analytics takes sales performance to the next level by forecasting future trends and behaviors.
With predictive modeling, you can enhance your sales forecasting efforts, allowing for better trend analysis and data-driven insights. By understanding customer behavior and market predictions, you can optimize your sales strategies effectively.
This approach not only aids in performance optimization but also supports risk assessment, helping you to navigate uncertainties in the market. Through competitive analysis, you gain a clearer picture of where you stand against rivals, enabling you to adapt your tactics proactively.
Embracing predictive analytics ultimately empowers you to make informed decisions that drive sales success.
Integrating Sales Analytics With Other Business Functions
While many companies focus solely on sales analytics, integrating it with other business functions can greatly enhance overall performance.
By fostering cross-functional collaboration, you can uncover insights that drive better decision-making and strategy alignment.
Here are three key benefits of analytics integration:
- Improved Customer Insights: Combining sales data with marketing and customer service analytics helps you understand customer behavior and preferences.
- Streamlined Processes: Integrating sales analytics with operations allows for efficient resource allocation, reducing costs and increasing productivity.
- Enhanced Forecasting: Collaborating with finance and supply chain teams provides a thorough view, leading to more accurate sales predictions.
Future Trends in Sales Performance Analytics
As the landscape of sales performance analytics evolves, staying ahead of future trends is essential for maximizing your sales strategy.
Future technologies like artificial intelligence and machine learning will empower you to leverage predictive modeling, enhancing your ability to forecast sales outcomes.
Automated analytics will streamline data integration processes, allowing you to harness big data efficiently.
Cloud solutions will enable real-time access to insights, while mobile dashboards will guarantee you can monitor performance on the go.
Prioritizing user experience in these tools will make data more accessible and actionable, leading to informed decision-making.
Frequently Asked Questions
What Tools Are Best for Creating Sales Performance Dashboards?
For creating sales performance dashboards, you’ll want to use dashboard visualization tools like Tableau or Power BI. They excel in sales metrics tracking, helping you visualize data effectively and make informed decisions quickly.
How Often Should Sales Dashboards Be Updated?
You might think daily updates are overkill, but real-time updates keep you sharp. Generally, aim for weekly refreshes; it balances frequency recommendations with practicality, ensuring your data stays relevant without overwhelming you.
Can Sales Analytics Be Integrated With CRM Systems?
Yes, you can seamlessly integrate sales analytics with CRM systems. This CRM integration enhances data visualization, allowing you to track performance metrics effectively and make informed decisions based on real-time insights. It’s a game-changer!
What Training Is Needed to Interpret Sales Performance Data?
You’ll need a PhD in data interpretation, right? Just kidding! You just require strong analytical skills, some practice with data sets, and maybe a sprinkle of common sense to make sense of sales performance data.
How Do I Ensure Data Accuracy in Sales Analytics?
To guarantee data accuracy in sales analytics, you should prioritize data validation and source verification. Regularly check your data sources, implement consistent processes, and use reliable tools to catch errors before they impact your analysis.
Conclusion
Incorporating sales performance analytics into your strategy isn’t just smart—it’s essential. Did you know that companies using data-driven sales strategies see a 5-6% increase in productivity? By leveraging individual and team dashboards, you can enhance collaboration and drive performance. Real-time reporting and predictive analytics will keep you agile in a fast-paced market. Embrace these tools to not only meet but exceed your sales goals, ensuring you stay ahead of the competition.


